Global debt looks set to weigh heavily on financial markets and economies in the short and medium term. We explain how and why.
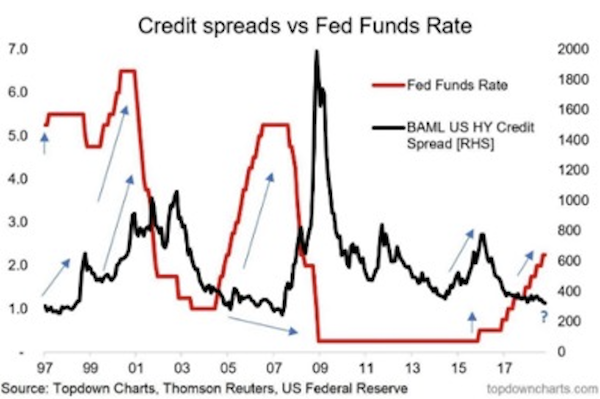
A former JP Morgan Fleming fund manager colleague of mine succinctly featured the graph below as his “Chart of the Week” recently. It certainly captures what we believe is the biggest risk to global markets moving into 2019, the cost of debt rising, arresting economic growth and forcing the prices of riskier assets down.

What is the chart telling us? The red line is the Fed Funds rate, the interest rate set by the world’s most important Central Bank, the US Federal Reserve. It shows the periods of rising and falling interest rates. When the red line rises, the US Fed was (and is) acting to slow economic activity in a bid to rein in consumer price inflation. The previous two times the Fed engaged in big cycles of raising its Fed Funds rate (1999-2000 and 2005-2007) what happened after was a higher cost of debt for businesses. As you can see, the Fed has raised its interest rate 8 times since 2015.
So what will happen to the cost of debt for businesses? The black line is a credit spread. This number is an index (average) of the number of basis points (presently 341 basis points, or 3.41%) that is the difference between the yield (interest rate) on riskier (“high yield”) companies and the borrowing cost of the US government (the cost of President Trump’s government borrowing for 10 years is priced at around 3.2% per annum today). You can see that in the past an effect of the red line rising was a spike in the black line some time later. This chart suggests that the black line will rise again some time soon. And a spike in the black line even to levels seen in 2011 or 2016, will add a lot to the cost of debt for riskier US businesses.
Why does this matter? If businesses have to pay more for their debt, they have to grow faster, cut other costs or they will generate lower profits. If they grow faster, the US Fed will most likely raise the red line even more. Cost-cutting is difficult when unemployment is so low in America. So it looks like profitability should fall. This may be bad news for earnings prospects in the stock market and those larger 2000-01 and 2008-09 spikes in the black line coincided with recessions in the US economy. In the US stock market the price being paid as a multiple of profits or assets (price/earnings or price to book (assets)) is very high presently: this does not look attractive.
It matters elsewhere as well. Due to the present setup of the global financial system, the move up in the red line affects interest and debt funding rates and yields all around the world. From Turkey to ASEAN to India, we are seeing higher bond yields. Many central banks are hiking their interest rates, to protect against inflation imported via their currencies weakening versus the US dollar. And in places like China, the world’s second-largest economy and in Italy, many commentators worry a lot about debt piles and the effect of future interest rate rises/a higher cost of debt.
Total global debt, according to one 2018 estimate from the IIF stands at USD 247 trillion, some 60% higher than in 2008. Paying the interest on this debt pile will be a significant challenge if interest rates rise. And the cost to all of us if we want economic growth to continue without higher interest rates will be inflation. And, eventually, slower economic growth.


